A beginner’s guide to alternative data
Understanding what alternative data is and how it's changing the finance industry
Feb 5, 2026

What is alternative data?
For a newcomer to our space, the term ‘alternative data’ can sound overly technical, but it can actually be explained very simply. Let’s start by first defining ‘data’ itself.
Broadly, data can be thought of as information that’s collected and then used for analysis. Almost every action that humans take, particularly when we act as consumers in a digital world, leaves behind a trail of data in our wake. Data helps us explain why and how things happen and helps us inform our decision-making processes.
Data is particularly useful in industries such as financial services, where investors use this information to make decisions about the types of investments they should make. These investors may use data to decide whether an individual company, industry or sector is worth investing in, or how they should bet on the health of an individual country or the global economy.
Traditionally, investors have used data derived from the historical prices of stocks, bonds and other financial instruments. This type of data is highly structured and is backward-looking, as it incorporates historical price information.
What makes data alternative?
So, what makes a dataset ‘alternative’? Alternative data typically refers to data used within the financial services industry that is gathered from non-traditional or unofficial sources. Users of alternative data are looking to improve their investment decisions and gain a competitive edge when trading financial products like stocks and bonds in markets, or when investing in private-market deals.
This type of data can be recorded in real- or near-real time and is typically derived from unorthodox sources, such as satellites, sensors connected to the internet and consumers’ smartphones. Alternative data is mostly unstructured and has to be analysed by a data science professional to extract value.
Alternative datasets can also be combined with other data, both traditional and alternative, to form a fuller picture of the world.
While traditional data has only limited sources, alternative data collection is only limited by your imagination. Think about it – in our interconnected world, we can obtain useful data from medical equipment, live traffic updates, online browsing activity and even your daily step-count.
The COVID-19 pandemic was an early catalyst for both the supply of and demand for alternative data. As more activity moved online, more data about consumers’ and businesses’ daily activities was generated. At the same time, many new types of users, such as banks, consulting firms and corporations, turned to alternative data to help them understand changing human behaviour. Advances in technology have also made it easier to gather data and monetise it. That adoption curve has continued since, most recently driven by the rise of AI, which is reshaping both how alternative data is produced and how it is consumed.
When applied specifically to investing, alternative data can provide insight into the future performance of target organisations or industries, which allows investors to identify the most likely avenue for making a profit
What is the difference between alternative data and market data?
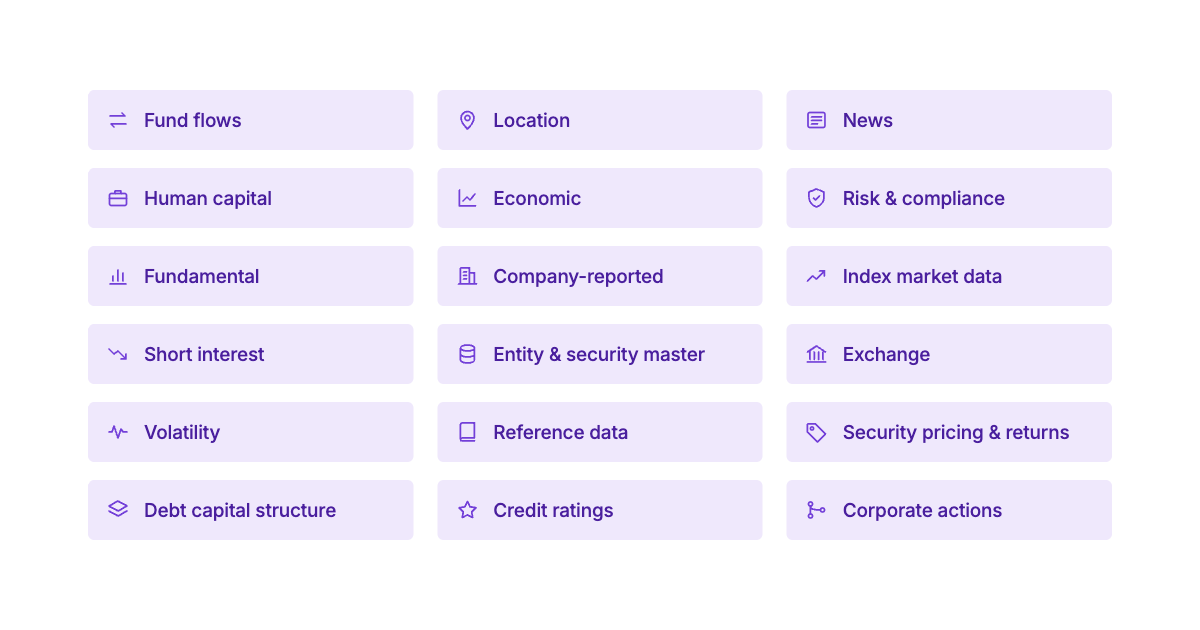
The traditional data mentioned above is often called market data. It covers the sources investors have long used for standard analysis, such as exchange pricing feeds and company filings. It comes from established sources, is highly structured and is widely accessible, usually because regulation or convention requires it. Alternative data comes from unconventional sources, is less accessible and less structured, and is often collected through crowdsourcing or web-scraping. Sophistication does not decide the split: even nanosecond-level exchange data is market data. Some categories, such as flow data, sit on the border between the two.
What are data providers?
In recent decades, a huge increase in computing power, combined with the enormous adoption of personal computers and mobile devices around the world, has caused massive growth in data generation. As a direct result, companies have begun to collect and analyse this vast expanse of data and offer it as a product to inform investment decisions. These companies are called data providers or data vendors.
A data provider sources and collects datasets, which it then provides or sells to hedge funds and other data users. An alternative data vendor may simply collect the data, or it may structure, clean and even analyse the data before providing it to the end user.
Alternative data providers use external partners like Neudata to help them form relationships with data buyers. At Neudata, we specialise in helping data vendors by introducing them to relevant data buyers interested in unique sources of data. Because Neudata sits between data buyers and data sellers, we’re in a unique position to help you market your data and provide market intelligence about your product.
Since 2016, Neudata has been the only provider of data scouting services that does not require vendors to pay a commission or enter into a revenue-sharing agreement to list their data. Today, the platform covers over 11,000 dataset reports from more than 4,200 data providers, used by over 1,000 active data buyers to facilitate more than $250m in data-product transactions each year.
How is alternative data changing the finance industry?
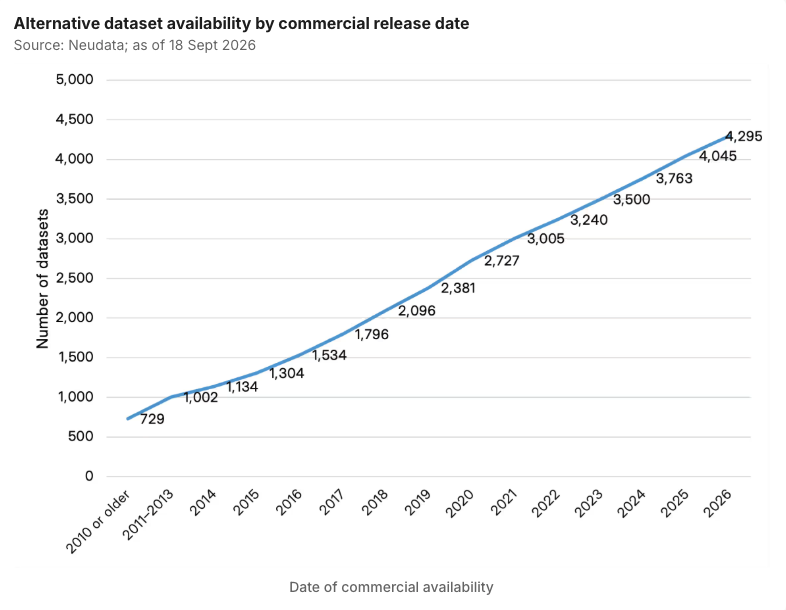
Alternative data usage has been important in the financial services industry for several decades, but its adoption has expanded rapidly in the past 10 to 15 years.
Quantitative hedge funds were the original innovators, but now practically everyone in the financial services industry utilises alternative data in some form. It’s now being used to provide competitive insights that would be unavailable when only using traditional sources of investment information.
Leveraging alternative data in this way has allowed investment managers, funds and firms to generate alpha, a term that’s used to describe an investment strategy’s ability to beat the market. Alternative data is enabling investors to uncover new investing opportunities and helping to de-risk their portfolios, truly transforming the way finance professionals conduct business.
How is AI changing alternative data?
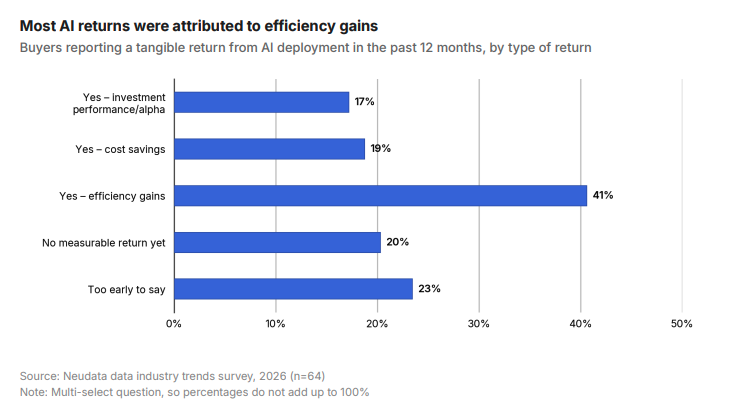
AI is reshaping the alternative data industry. Data buyers are using AI and large language models to process and analyse data faster: in Neudata's 2026 industry survey, 56% of data buyers reported a tangible return from AI deployment over the past 12 months, though so far this shows up more as efficiency gains (41%) than as improved investment performance (17%).
Data providers are also increasingly offering access to their datasets via Model Context Protocol (MCP), which lets buyers feed data directly into their AI models; just under half of providers now offer MCP access, and most do so at no extra charge.
AI is also starting to affect data quality itself. In the same survey, a third of buyers reported a deterioration in the quality of their data sources over the past one to two years, and of that group, around three in five attributed it at least partly to AI-generated content, roughly one in five buyers overall. For anyone new to alternative data, it's worth knowing early that AI is not just a tool for using data, it is also starting to shape what's in it.
What types of datasets are there?
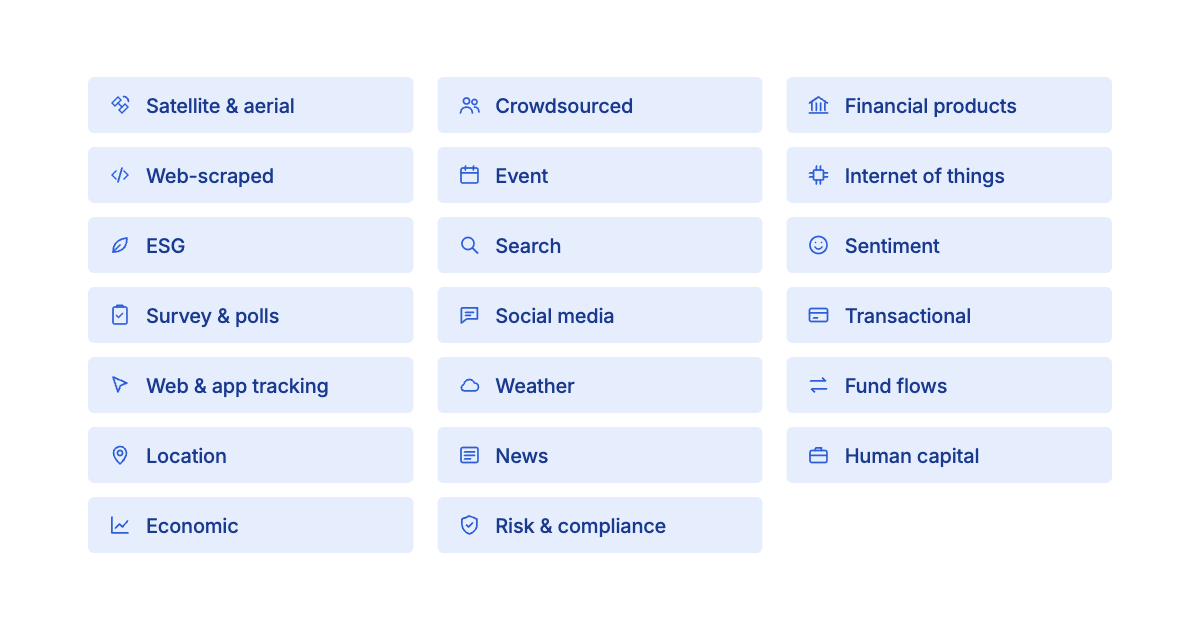
Neudata provides research on over 11,000 datasets across 21 proprietary data categories:
Consumer transaction data
As the name suggests, consumer transaction data provides visibility into financial transactions made by consumers. For example, when a user purchases a product/service or makes a deposit into/withdrawal from an account.This type of information is extremely valuable to many different types of businesses, primarily because it provides insight into the behaviour of consumers and shows the products and industries that are gaining traction or falling out of favour. In other words, it can provide a window into company performance or be used to analyse macroeconomic trends.
Crowdsourced data
Crowdsourced data is collected directly from individuals, usually through apps, websites or platforms. Examples include user-submitted salary data and prices or store checks gathered by contributors in emerging markets. It can reach buyers ahead of official statistics, but crowdsourced data may work best alongside sources with a firmer statistical basis.
Economic data
Economic data covers macro and micro indicators, such as employment, wages, inflation and gross domestic product (GDP), which show the health of economies. Alternative sources can give a timelier view than official statistics, for example by forecasting labour market releases in advance or online prices where official inflation figures fall short.
ESG data
ESG data tracks how well companies are fulfilling environmental, social and governance goals. Investors typically use ESG data to both assess a company’s performance on ESG metrics and its risk profile. Alternative sources of ESG data tend to be extremely helpful to users who otherwise have to rely on self-reported metrics that can lead to ‘greenwashed’ results.Environmental data typically provides insights into a company’s sustainability metrics, while social data explores the treatment of people (employees, suppliers, individuals and groups). Governance data allows users to delve deeper into the structure of rules, practices and processes used to direct and manage a company, potentially uncovering things like corruption and how well a company is adhering to regulations.
Event data
Event data captures specific occurrences that can move markets, such as breaking news, product launches and company announcements. Providers range from real-time news alerting services to sources of indirect company signals, such as hiring activity and patent applications. Real-time signals need context, because they can lead to wrong conclusions.
Flow data
Flow data tracks the movement of money in financial markets, such as fund flows, to show investor sentiment and behaviour. Neudata’s research in this area covers country-level capital flows, fund flows, allocations and positioning data and retail investor activity.
Fundamental data
Fundamental data comes from the financial statements that listed companies file with regulators or publish through exchanges: the income statement, balance sheet and cash flow statement. Because every vendor starts from the same filings, the differences lie in how each standardises line items, whether it keeps figures as originally reported and how quickly the data reaches clients. Buyers use it to determine a business’s intrinsic value, and it underpins most equity investment processes.
Geolocation / location data
Geolocation data is any type of data that determines the precise (or as close to precise as possible) location of a person, object or place. This type of data is typically collected through smartphones and other internet-enabled devices.Often cited as the quintessential investment management use case, location data sources can help users model consumer behaviour at physical locations and forecast future financial performance, assess migration patterns that shed light on macroeconomic trends and more.
Internet of things
Internet of Things (IoT) data comes from physical objects with Internet Protocol (IP) addresses that communicate over the internet. It includes sensor readings, for example from connected vehicles, that give near-real-time insight into operations and consumer usage, and datasets that monitor how many connected devices are deployed. Buyers use deployment data, for example, to track installations of new products, spot company-level business events and gauge cybersecurity risk.
News data
News data draws on articles and feeds from media publishers, which investors use to gauge market sentiment and track market-moving stories. Providers either supply feeds of the text itself or derive sentiment scores from it; sentiment outputs are often updated more than once a day, so many suit quantitative (quant) investors. Together with social media data, and the sentiment data derived from both, it is one of the most widely adopted types of alternative data among investors.
Satellite/aerial data
Satellite and aerial data uses overhead imagery to track activity on the ground, such as agricultural output and urban development. Providers offer change detection, from spotting new buildings, roads and vehicles to measuring vegetation, soil water retention and surface temperature. Applications range from ESG to real estate investing and tracking trucks at a distribution centre.
Search data
Search data comes from search engine activity. Investors use it as a proxy for attention, especially retail investor activity, to estimate economic indicators such as unemployment and consumption ahead of official releases, and to track consumer trends and brand performance. Its limits include ambiguity over whether a search signals intent, interest or sentiment.
Sentiment data
Sentiment data attempts to quantify people’s feelings and emotions towards certain events or products.
Vendors that operate in this space typically use machine learning techniques like natural language processing to analyse news events, reviews and social media posts to understand what topics people find interesting. Then, vendors will assign scores that reveal whether people’s opinions are changing positively or negatively towards a specific security or event.
In addition to being used to understand sentiment on a micro level, this data can be used in a macro context to understand how broader human sentiment is driving world events.
Social media data
Social media data covers content from platforms such as Facebook, Instagram, TikTok and X. Investors use it to gauge market sentiment and spot emerging trends; some providers supply feeds of the raw text and others turn it into sentiment scores mapped to tickers. Retail investor sentiment is a common focus, drawn from sources such as StockTwits and Reddit.
Surveys and polls
Surveys and polls data aggregates responses from targeted groups, such as IT decision makers or healthcare professionals, to gauge opinions, preferences or forecasts. Some providers run recurring surveys; others run custom questions on a panel. Buyers use it, for example, to forecast IT purchasing trends or to learn about products ahead of launch.
Weather data
Weather data covers observations and forecasts. Public and government models are widely available, and their accuracy depends on factors such as spatial resolution, forecast length and model type, so some third-party vendors add proprietary observations to build their own forecasts. The main use cases are energy trading, agri-commodity trading, equity trading and weather derivatives.
Web-scraping and app-tracking data
Web-scraping data is information extracted from publicly available websites, usually by automated collection at scale. Investment firms, particularly hedge funds, use it alongside purchased datasets. Regulation of web-scraping itself is limited and still developing, so privacy and website terms of service points warrant review by counsel.
Next steps
To learn more about our individual solutions, see our solutions for data buyers or solutions for data sellers.

Truth API: What we know about Truth Social's paid data feed
Aug 13, 2026

Data monetization insights and opinions
May 28, 2026